The content on this page is marketing communication. Investment in funds always involves some kind of risk. Past performance is no guarantee for future performance. Fund units may go up or down in value and investors may not get back the amount invested.

East Capital Global Emerging Markets Sustainable

East Capital Global Emerging Markets Sustainable

NAV

492.24 EUR

1 day

+0.24%

YTD

+2.15%

Date

2025-07-30

Sustainability

Article 9

NAV

264.46 SEK

1 day

+0.39%

YTD

-0.69%

Date

2025-07-30

Sustainability

Article 9

NAV

155.47 USD

1 day

-0.42%

YTD

+12.63%

Date

2025-07-30

Sustainability

Article 9

NAV

123.03 CZK

1 day

+0.11%

YTD

-0.21%

Date

2025-07-30

Sustainability

Article 9

NAV

150.31 EUR

1 day

+0.24%

YTD

+2.39%

Date

2025-07-30

Sustainability

Article 9

East Capital Global Emerging Markets Sustainable is a high conviction fund of around 50 companies operating in emerging markets.

The investment process emphasises an “on-the-ground” approach to select high quality but reasonably valued companies that offer structural growth throughout the economic cycle. This results in a strong mid and small-cap bias and a high active share, typically above 80%.

Aware that stock returns are driven by much more than company quality, the team considers top-down drivers and makes a conscious and deliberate effort to remove the effects of cognitive and behavioural bias at each step of the investment process. ESG analysis is a key part of the research process, and is done by the investment team using proprietary tools in order to better understand the risks and opportunities of investee companies.

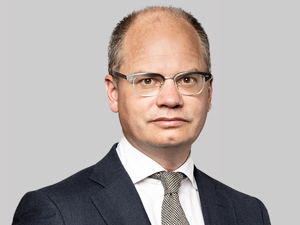
Jacob Grapengiesser, Chief Investment Officer and Partner, leads the Global Emerging Markets investment team. The core portfolio manager team has worked at East Capital for an average of 14 years. Most of the team are based in Hong Kong in order to be close to the key markets.

Q2 was an exceptionally strong quarter for emerging markets, which returned 12.0% in USD, outperforming the S&P 500, which returned 10.9%. Our fund returned 12.8%, outperforming the benchmark by 0.8%.

In H1 2025, emerging markets outperformed the S&P 500 for the first time since 2017, with USD-denominated returns boosted by currency strength, as the USD weakened due to concerns over policy uncertainty and rising deficits in the US. Once again, emerging markets proved they are a highly heterogeneous group of economies with their own specific drivers, which is why returns ranged from over 50% in Eastern European countries like Poland and Greece to below zero in countries such as Thailand, Turkey and Indonesia.

Looking at global markets, the main narrative has been around  the trade talks, which began with Trump's unexpected Liberation Day announcements on 2 April. Although this initially appeared to be the worst-case scenario, the “invisible hand” of the markets intervened and the sharp rise in US bond yields forced the US administration to delay the tariffs by 90 days, until 9 July. So far, President Trump has announced a few deals, for example with the UK and Vietnam, and he has maintained that he will not grant an extension. However, we wonder whether this will be the case. Naturally, we and all other investors will be watching the headlines closely until then.

China was the worst hit country, though we have already seen tariffs come down significantly, approaching 32% on a weighted basis. There is scope for further reductions, particularly given China’s underappreciated leverage  when it comes to rare earths, where they controlled 61% of mining and 91% of refining (and hence sales) in 2024. Following the tariff announcements, China’s decision to limit exports of rare earths had a real impact on the auto supply chains in the US, with Ford reportedly shutting one of its factories for a week due to a lack of rare earth magnets. Focusing on Q2, Taiwan and Korea were the largest drivers of emerging markets, with returns of 26.3% and 32.8% respectively. Taiwan experienced stunning currency appreciation of 13.9%, as foreign investors piled into local shares and exporters increased their USD holdings. Key exporters such as TSMC hedge their currency exposure, thereby reducing the impact on margins. TSMC’s results continued to improve, with April 2025 revenue growing 48% year-on-year, partly due to pre-buying before tariffs were implemented.

The Korean market performed exceptionally well in Q2 2025, with a return of 32.8%, as retail investors flooded into the market in anticipation of a more business (and crypto / AI) friendly government. As a result, the Korean index had its strongest performance in 26 years.

On a related note, we attended a fascinating meeting with the Asian Corporate Governance Association to discuss the “value-up” programmes they are working so hard to develop together with regulators around Asia - we recommend reading their latest report on this topic. We believe this theme is underestimated in terms of its ability to generate returns, as there are plenty of low hanging fruits. For example, we don’t think many investors are aware that in companies in China with a P/B ratio below 1.0x for more than 12 months are required to publish an action plan detailing how they intend to improve this through better capital allocation/dividends.

However, this is almost more important in Korea, where non-transparent chaebols (holding companies) dominate and could really benefit from programmes like this.  We have been exploring this theme through our significant investment in KB Financial, one of the largest banks, which we met in Hong Kong in March. The company has drastically improved its approach to capital allocation and can articulate it in a relatively straightforward way. This is starting to be reflected in its performance. The company has returned 44% to us in H1, generating 102bps of alpha.

As usual, it was a busy quarter for travel. We had a successful trip to Brazil, where the local sentiment was the best that we have seen in a long time. The general view is that the rate-hiking cycle, which was necessitated by inflationary fiscal policies ("like driving with your feet on both the brake and the accelerator", as one local investor put it) has now come to an end. A presidential election is also approaching, which could result in the election of a much more market-friendly candidate. The favourite is the current São Paulo governor, Tarcísio de Freitas. We increased the beta in our Brazilian holdings this year based on this improving sentiment. This has paid off, as our stocks have returned 33% compared to 29% for the Brazilian names in the benchmark. One company we particularly like is Smartfit, the largest gym chain in Latin America, which has a dominant market position in a highly fragmented and underpenetrated sector. For example, only 5% of Brazilians have gym memberships, compared to around 15% in the US and Europe.

We also attended Prosus’s investor day, one of our largest holdings. We like the tech holding company because of its straightforward capital allocation policy of selling shares in Tencent (its largest holding) and using the proceeds to buy back its own shares. This has been highly beneficial, as a few years ago the discount was as high as 50%. Thanks to this policy, the discount has now narrowed to 28%. However, the key focus of the capital markets day was to highlight the cash generation and growth opportunities of Prosus’s non-China businesses, for example, in Latin America and India. Although free cash flow generation outside of Tencent turned positive last year and is set to grow considerably in the next few years, we believe that the market is not yet attributing any value to this.

Looking ahead, we believe that emerging markets are still in a sweet spot, as global investors are starting to question their substantial exposure to US equities and, consequently, their USD-denominated revenue streams. Given that the "big, beautiful tax bill" is set to increase the US deficit further and that policy uncertainty is likely to continue, we certainly see the logic in diversifying further away from the US.

We published an article entitled The Return of Emerging Markets, in which we outline the main drivers for this asset class. In short, we argue that, over a decade of underperformance has left emerging markets much more reasonably priced than the US, despite the former having much better growth prospects and clear macroeconomic triggers, such as falling inflation and interest rate cuts. We acknowledge that sustained rallies will require a more robust recovery in the Chinese economy, which we have yet to observe. Nevertheless,  there are some tentative positive signs, such as rising real estate prices in Tier 1 cities like Beijing and Shanghai. In general, we believe that innovation is gradually shifting towards emerging markets, from cutting-edge chip manufacturing in Taiwan to electric vehicles/batteries in China. While this is not yet reflected in valuations, it is vitally important for investors concerned about the future.

Our fund is valued at 11.7x P/E, with expected earnings growth of 15.8% for 2025. This is considerably above the benchmark, which is expected to demonstrate EPS growth of 8.1% with a valuation of 13.6x.


Performance in USD net of fees.

This publication is not directed at you if we are prohibited by any law in any jurisdiction from making this information available to you and is not intended for any use that would be contrary to local laws or regulations. Every effort has been made to ensure the accuracy of the information in this document, but it may be based on unaudited or unverified figures or sources. The information in this document should not be used as the sole basis for an investment. Please read the Prospectus and the KID, which are available on the fund page.

East Capital Global Emerging Markets Sustainable is an Article 9 fund under the EU Sustainable Finance Disclosure Regulation (SFDR) which means that we are explicitly looking to invest in companies that have a positive impact on the world around them in addition to outperforming the market.

The key proprietary tool developed to assess this has been highlighted on various occasions by the PRI - UN Principles for Responsible Investment. The implications of this approach are that the fund:

  • Doesn’t invest in fossil fuel companies and most mining companies
  • Has a strong quality bias
  • Aims to identify the future “ESG darlings” of the market before the ratings agencies and international banks 

You can find key documents explaining the sustainability process and outcomes in the "Sustainability" section.

Jacob Grapengiesser

Please accept marketing-cookies to watch this video.

Why invest in Emerging Markets?

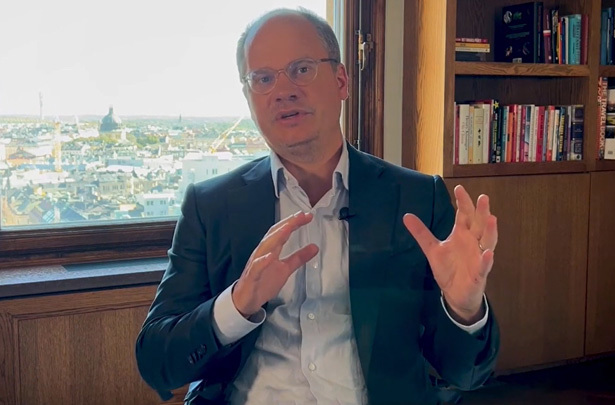
Watch as Jacob Grapengiesser (CIO) and David Nicholls (Portfolio Manager) present the fund East Capital Global Emerging Markets Sustainable.

Watch the video

Please accept marketing-cookies to watch this video.

Geographical Split

Sector Allocation

Largest Holdings

Fund facts

Fund

East Capital Global Emerging Markets Sustainable A EUR

ISIN

LU0212839673

Launch date

2005-05-09

Domicile

Luxembourg

Morningstar Rating™ (Total rating)

4

Yearly fee

1.96%

Management fee

1.50%

Benchmark

MSCI Emerging Markets (dividend adjusted index)

Fund

East Capital Global Emerging Markets Sustainable A SEK

ISIN

LU0562934264

Launch date

2010-12-01

Domicile

Luxembourg

Morningstar Rating™ (Total rating)

4

Yearly fee

1.96%

Management fee

1.50%

Benchmark

MSCI Emerging Markets (dividend adjusted index)

Fund

East Capital Global Emerging Markets Sustainable A USD

ISIN

LU1758601261

Launch date

2019-03-12

Domicile

Luxembourg

Morningstar Rating™ (Total rating)

4

Yearly fee

1.95%

Management fee

1.50%

Benchmark

MSCI Emerging Markets (dividend adjusted index)

Fund

East Capital Global Emerging Markets Sustainable A CZK

ISIN

LU2223384681

Launch date

2020-10-05

Domicile

Luxembourg

Morningstar Rating™ (Total rating)

3

Yearly fee

1.96%

Management fee

1.50%

Benchmark

MSCI Emerging Markets (dividend adjusted index)

Fund

East Capital Global Emerging Markets Sustainable R EUR

ISIN

LU0864106058

Launch date

2019-10-25

Domicile

Luxembourg

Morningstar Rating™ (Total rating)

4

Yearly fee

1.60%

Management fee

1.10%

Benchmark

MSCI Emerging Markets (dividend adjusted index)

Risk indicator

Funds with risk class 6-7 can have sharp decreases or increases in value.

Lower risk

Higher risk

Lower possible return

Higher possible return

Lower risk

Higher risk

Lower possible return

Higher possible return

Lower risk

Higher risk

Lower possible return

Higher possible return

Lower risk

Higher risk

Lower possible return

Higher possible return

Lower risk

Higher risk

Lower possible return

Higher possible return

More information

Reporting of the fund's historical returns does not consider inflation.

Past performance of East Capital Global Emerging Markets Sustainable prior to 9 January 2019 relates to East Capital Emerging Asia, which from 9 January 2019 was reorganised with a new objective and investment policy. East Capital China Environmental merged into Global Emerging Markets Sustainable on 25 October 2019.

2022-04-01

The merger of the Funds East Capital Balkan, East Capital New Europe, East Capital Russia and East Capital Eastern Europe with East Capital Balkans, East Capital New Europe, East Capital Russia and East Capital Eastern Europe (respectively) has been carried out in accordance with the submitted merger plan, which was approved by Finansinspektionen (the Swedish Financial Supervisory Authority) on 15 February 2022.

East Capital Balkans, East Capital New Europe, East Capital Russia and East Capital Eastern Europe thus ended on 1 April 2022.

Following the merger, former shareholders in East Capital Balkan, East Capital New Europe, East Capital Russia and East Capital Eastern Europe now own shares in East Capital Balkans, East Capital New Europe, East Capital Russia and East Capital Eastern Europe.

More information about the merger, such as the auditor's opinion on the exchange relationship, can be obtained from the management company East Capital Asset Management S.A. upon request.

Investing through a financial intermediary may impact the investor’s rights to compensation in the event that compensation is paid due to errors or non-compliance.

The Global Industry Classification Standard (“GICS”) was developed by and is the exclusive property and a service mark of MSCI Inc. (“MSCI”) and Standard & Poor’s, a division of The McGraw-Hill Companies, Inc. (“S&P”) and is licensed for use by East Capital. Neither MSCI, S&P nor any third party involved in making or compiling the GICS or any GICS classifications makes any express or implied warranties or representations with respect to such standard or classification (or the results to be obtained by the use thereof), and all such parties hereby expressly disclaim all warranties of originality, accuracy, completeness, merchantability and fitness for a particular purpose with respect to any of such standard or classification. Without limiting any of the foregoing, in no event shall MSCI, S&P, any of their affiliates or any third party involved in making or compiling the GICS or any GICS classifications have any liability for any direct, indirect, special, punitive, consequential or any other damages (including lost profits) even if notified of the possibility of such damages.

The MSCI information may only be used for your internal use, may not be reproduced or redisseminated in any form and may not be used as a basis for or a component of any financial instruments or products or indices. None of the MSCI information is intended to constitute investment advice or a recommendation to make (or refrain from making) any kind of investment decision and may not be relied on as such. Historical data and analysis should not be taken as an indication or guarantee of any future performance analysis, forecast or prediction. The MSCI information is provided on an “as is” basis and the user of this information assumes the entire risk of any use made of this information. MSCI, each of its affiliates and each other person involved in or related to compiling, computing or creating any MSCI information (collectively, the “MSCI Parties”) expressly disclaims all warranties (including, without limitation, any warranties of originality, accuracy, completeness, timeliness, non-infringement, merchantability and fitness for a particular purpose) with respect to this information. Without limiting any of the foregoing, in no event shall any MSCI Party have any liability for any direct, indirect, special, incidental, punitive, consequential (including, without limitation, lost profits) or any other damages. (www.mscibarra.com)