East Capital Global Equity Outlook – Fat and flat for 2023?

After two decades of ultra-low interest rates and abundant liquidity, 2022 has likely marked the end of a lucrative equity super-cycle. We expect that we are entering a period of “fat and flat” returns, which will be characterised by heightened volatility and more modest real returns as central banks withdraw USD 2 trillion of liquidity from the system in 2023.
For equity investors, returns in 2023 specifically will likely hinge on a few key questions such as whether the US will be able to engineer a soft landing whilst bringing down core inflation, when China will open fully and if there can be an end to the conflict in Ukraine.
In a globally diversified portfolio, we believe it makes sense to allocate to emerging markets, as the majority of these markets are at different points in their economic cycles compared to developed markets and, at the same time, trading at up to one standard deviation below 10-year average valuations. The US on the other hand is trading in line with its average, at 18.4x forward PE compared to 11.7x for emerging markets.
1. End of an era
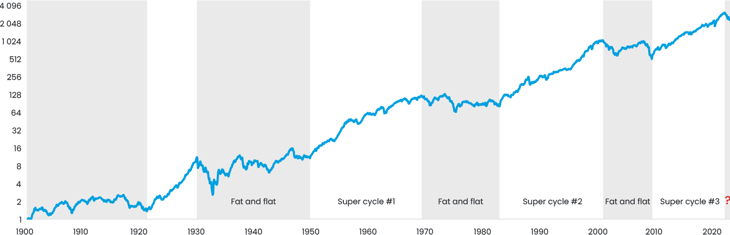
Post-war equity markets can be characterised by three super cycles, as we show in Figure 1. The most recent cycle was driven by quantitative easing and low rates following the 2008 financial crisis, supported by relatively stable economic growth.
Figure 1. S&P total return since 1900 (log scale)
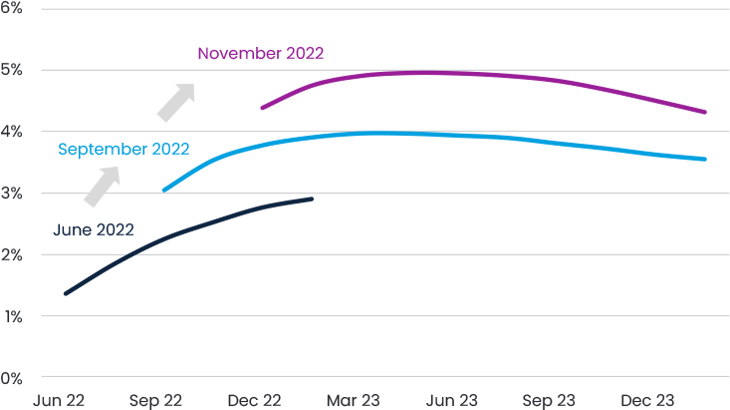
This goldilocks period came to an end with a bang in 2022, as shown in Figure 2, with a broad-based repricing across assets despite a rally in the last few months. This was driven primarily by a drastic change in rate expectations as inflation turned out to be considerably less transitory than anticipated. This is well illustrated in Figure 3 which shows how market expectations of the Fed rate shifted throughout the year.
Figure 2. Total returns year-to-date in USD*
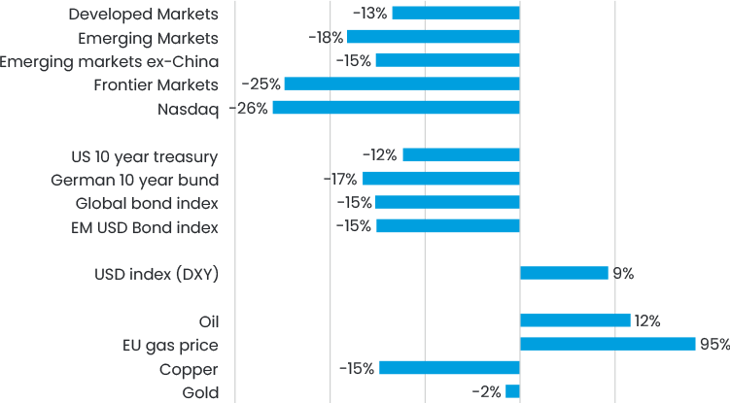
Figure 3. Market implied Fed funds rate
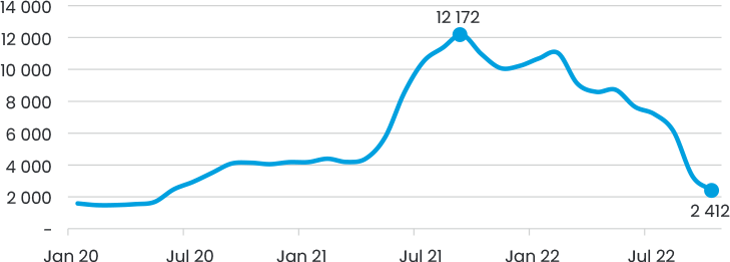
The one silver lining going forward is that we do expect a moderate slowdown in inflation driven partly by base effect and partly by the significant easing of supply side pressures. As Figure 4 shows, whereas in July 2021 it would cost over USD 12,000 to transport a 40ft container from Shanghai to Los Angeles, now it costs USD 2,400. The same trends can be seen looking at a variety of inputs, from steel (Black Sea HRC down 50% from its highs in 2021) to oil (Brent crude is down 33% from its highs earlier this year).
Figure 4. Cost to transport a 40ft container from Shanghai to Los Angeles (USD)
While the labour markets in the west remain hot, particularly in the US, we do believe that supply chain factors will mean inflation moderates in Q1, leading to a Fed pause sometime in H1, likely around 5%, and in line with the expectations in Figure 3. This is, of course, a key trigger for emerging and frontier market’s performance.
At the same time, the global growth backdrop will remain weak. Consensus is expecting just 1.8% GDP growth for 2023 after 2.9% in 2022. The big question is whether the US can engineer a soft landing and avoid a recession despite the aggressively rising rates to fight off inflation. Based on what we can see, and the extremely wide range of market forecasts, this is on a knife-edge. Data on the labour market and consumer spending still looks surprisingly resilient, and we hope this will remain.
What happens when the liquidity tide goes out
Since the start of quantitative easing in 2008, G4 central banks’ balance sheets (Fed, Bank of Japan, European Central Bank and Bank of England) have increased from USD 4 trillion to a peak of over USD 26 trillion, as shown in Figure 5. Since February 2020 (i.e. Covid-19), this figure has increased by a staggering USD 11 trillion or by 72% and markets rose by 40%, to their peak, despite the impact of Covid-19 on the global economy. More generally, this has been one of the key drivers for the equity super-cycle, where global equity markets rose by some 422% from their lows in early 2009.
Figure 5. G4 central banks' balance sheet (USD trillion) and total return of MSCI All-world Index
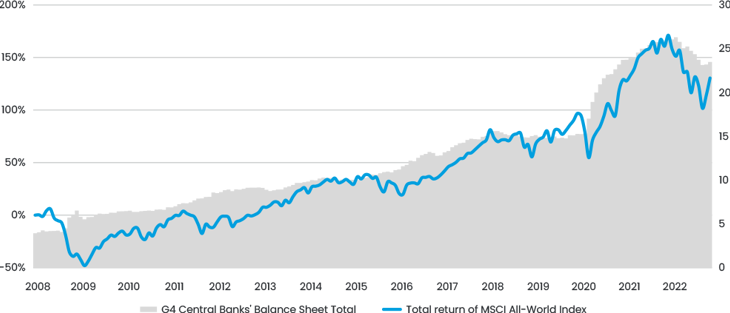
As of June 2022, central banks started removing liquidity from the system. This will remain the case for the next 12 months. In 2023, central banks are likely to withdraw a further USD 2 trillion of liquidity from the system (8.5% of current balance sheet), with USD 1.1 trillion of that coming from the Fed. This will have profound impacts on global markets – there will simply be less money in the system to invest.
From TINA to TARA
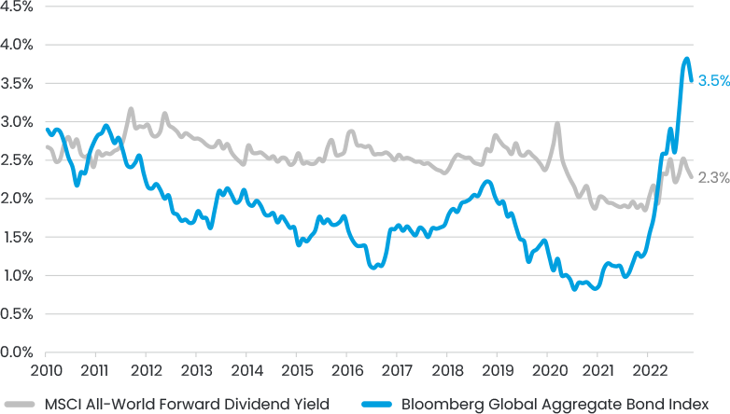
For what investment liquidity that is available, equity markets will have to grapple with the new acronym in town; TINA becomes TARA, i.e. “there is no alternative” becomes “there are reasonable alternatives”. This is clear from Figure 6, showing global bond yields are now higher than dividend yields for the first time in more than 10 years. This takes away a key argument that we have long been using regarding equity investing.
Figure 6. Global dividend and bond yields
Geopolitical tensions will not subside
It would be remiss to talk about global markets without mentioning geopolitics, particularly with the on-going conflict in Ukraine. However, there are other interesting elements such as the surprisingly proactive and protectionist anti-China stance that the US is taking, particularly on the chip and battery side. As has often been the case with geopolitics, these issues remain “grey swans” – difficult to predict though they can have a profound impact on global markets.
Fat and flat
While the majority of the above sounds fairly negative, we would argue that it is generally known information and hence already reflected “in the price”, something we discuss in more detail further down. What will move the markets are the grey swans such as an unexpected peace settlement in Ukraine or a harder landing in the US.
However, where we are more confident is that the above factors will mean the end of a spectacular equity bull run, that started with quantitative easing post the 2008 financial crisis, and the entrance to a period of “fat and flat” returns. In this environment, volatility will remain high (for example on China Covid-19 news) and returns will in general be less exciting. On a positive note, this is typically a good environment for stock pickers like us because valuations, company quality and fundamentals are what will really drive performance.
2. Will china finally open up?
While the developed world has been grappling with high inflation and rising rates, China has been suffering from a very different problem – that of lingering and highly restrictive Covid-19 lockdowns. Goldman Sachs recently estimated that the current level of restrictions is suppressing the level of GDP in the country by 4-5%, much of which could be recovered on a full reopening. This is important not just for China, but for the world given China represents some 19% of world GDP and has an outsized influence on commodity prices, with the rule of thumb from commodity traders being that China consumes “half of everything”.
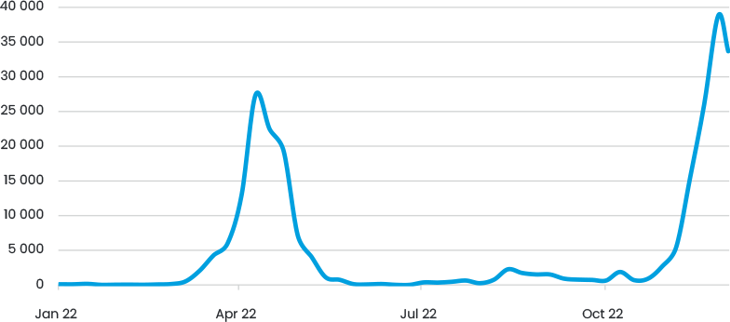
The view of our investment teams who are on-the-ground is that China is already opening-up. This is most apparent in the surge of Covid-19 cases, as shown in Figure 7, and the fact that 18,000 runners participated in the Shanghai Marathon on 27 November. However, with just 51% of over 80-year-olds fully vaccinated and question marks over the efficacy of the local vaccines against Covid, we think that despite the current protests, further opening will be gradual and rolling lockdowns will remain. We would expect that it won’t be until Q2 that we have a fully open Chinese economy as China needs to significantly advance the vaccination of its elderly population in order to avoid high death tolls. Thus, they will likely wait to open until the end of the flu season and until after the mass movement of people that comes with the Spring Festival / Chinese New Year in January. In addition, it will take some time to rewrite the official narrative that Covid is still very dangerous and to increase hospital capacity for unavoidable spikes in Covid-19 related hospitalisations.
Figure 7. No. Of new daily Covid-19 cases in mainland China
We are also encouraged by recent measures aimed at the stabilisation of China’s ailing property market, which represents roughly 30% of Chinese GDP1. In early November, the government announced 16 measures to support the property sector. The key focus of the policies is to ease the liquidity crisis faced by developer and construction companies as well as to support homebuyers. The likely recovery of the property market will further add to the positive sentiment towards Chinese equities as the sector is a key pillar of the economy.
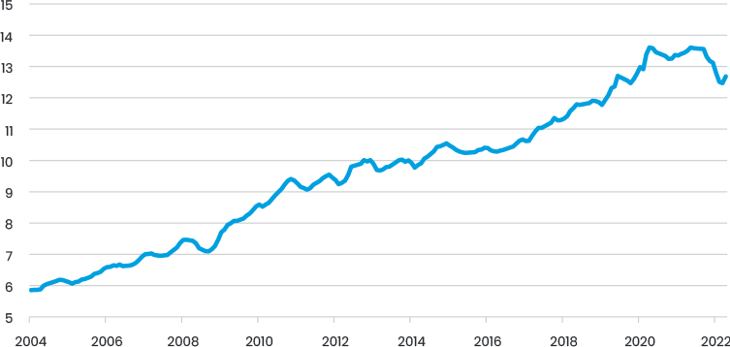
Easing Covid-19 restrictions and an improving property market will have significant impacts on growth, and could lead to China being the only large country where growth would accelerate in 2023; moreover the gap between the US and Chinese growth will be the largest for at least six years (excluding 2020), with the consensus currently expecting 4.9% GDP growth in China and 0.4% in US, something that means the equity markets should perform, especially given the valuation gap between US and China (discussed below). It could also have a large impact on the oil markets, as highlighted in Figure 8, which shows how much the rolling lockdowns and transport restrictions have affected oil demand.
Figure 8. China Daily Oil Demand (mb/d)
3. Have we passed the peak in usd strength?
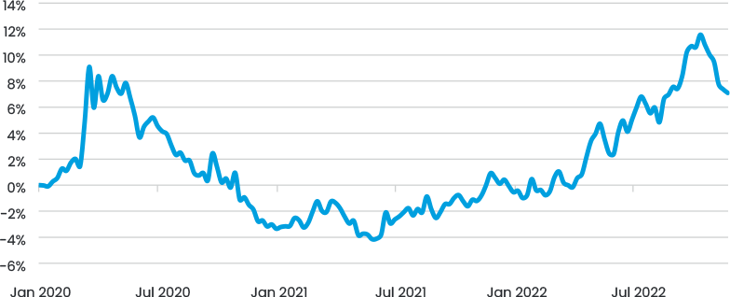
One of the major drags on emerging and frontier markets performance historically has been the surging USD driven by strong rate differentials and a flight to safety. At one point the USD was up 16% on a trade weighted basis compared to its lows in mid-2021. However, as shown in Figure 9, this has started to turn as the market starts to consider a potential Fed pivot and focus more on the economic woes that the US is likely to face.
Figure 9. Trade weighted USD since January 2020
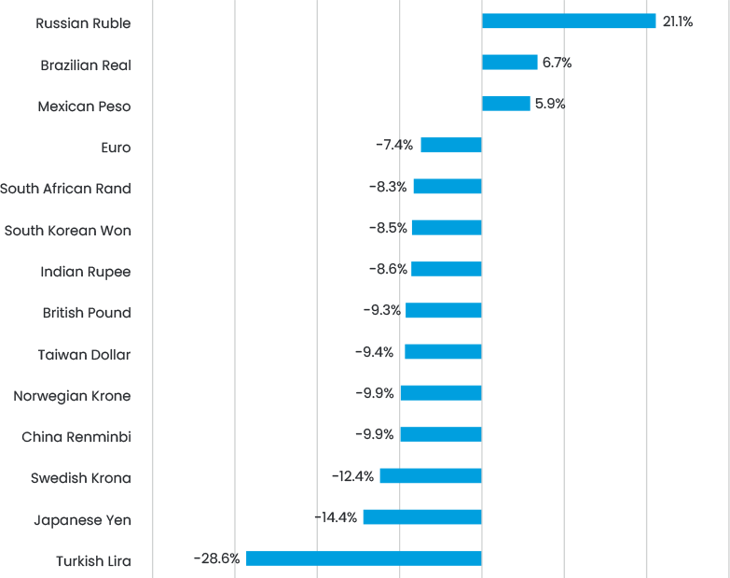
Interestingly the emerging market currencies have generally held up better than their G7 counterparts, as shown in Figure 10. However, this of course means there is less space for a large rebound, although we believe the USD will continue weakening throughout 2023, which is a major positive for emerging markets.
Figure 10. Year-to-date currency returns vs USD
4. What does all of this mean for emerging and frontier markets?
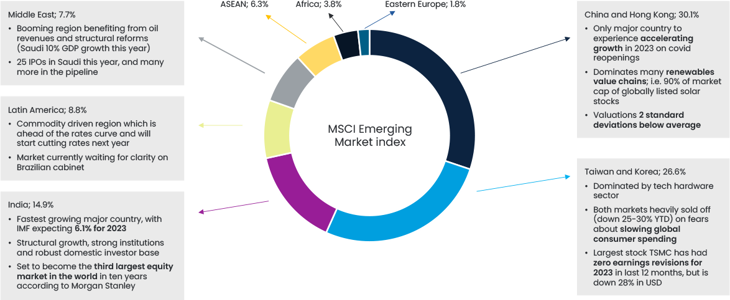
One key conclusion we have from 2022 is that it has never been more difficult to consider emerging markets as one homogenous asset class. As illustrated in Figure 11, there is a very wide range of markets, each with their own individual drivers. One important aspect of this range of countries in general is that they are suffering less from the inflation and growth problems of developed markets. As a result, the GDP growth differential between developed and emerging markets will be the highest for quite a few years (seven years based on the IMF forecasts), something that supports the emerging markets case.
Figure 11. Anatomy of global emerging markets
Frontier markets are even more divergent than their emerging peers, given weak economic ties within and across regions (think about Pakistan and Vietnam in Asia, or Nigeria and Kenya in Africa) and the lack of significant passive flows chasing the same investment opportunities. Economic growth in frontier markets, on the other hand, is typically stronger than in their developed and emerging market peers, resulting in at least as good (if not higher) expected returns with likely lower volatility given lower correlations. An even better investment idea is to blend frontier markets with select smaller emerging markets in a bid to improve the risk/return profile even further while making the universe more appealing to a larger investor base. To create an improved benchmark which might become mainstream for investors seeking uncorrelated returns, we recently initiated an engagement with MSCI and will report back if we see tangible developments on the process.
Many of our conversations this year have been on the investability in and the role of China in the emerging markets context. Of course, this peak pessimism has been reflected in positioning. This was why emerging markets had one of their best months ever in November, returning 15% as the US-listed Chinese stocks returned 42% on the back of clear signs that China is opening and facing its property crisis head on. While we understand why investors might be looking at emerging markets ex-China exposure, given its dominance in the benchmark, we believe that China is a broadly investible country and it would be a mistake to completely overlook it, as investors saw first-hand in November. This is not least of all because of the completely dominant role China plays in the renewables value chain, which is a sector supported by the government and one that will offer strong structural growth for many years to come.
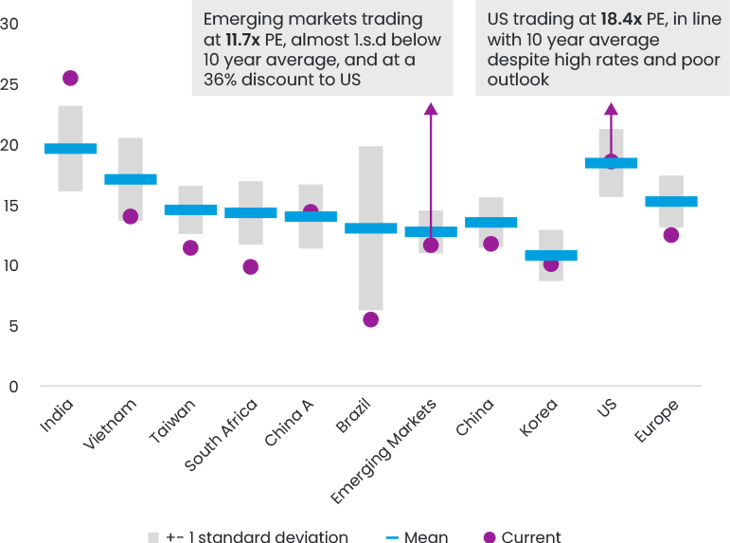
Looking ahead to 2023, we believe that valuations will remain in focus, and after a few years of underperformance, emerging and frontier markets are generally trading at up to one standard deviation below 10-year mean valuations, as we show in Figure 12. The US, on the other hand, is trading in line with its average, at 18.4x forward PE compared to 11.7x for emerging and 9.0x for frontier markets.
Figure 12. Forward PE ratios compared to 10-year average
However, we don’t invest in the index per se, and instead focus on a small number of high conviction, high-quality companies with strong sustainability profiles from each country, many of which aren’t even in the index. It’s when we look at these companies that we get more excited, because these are all trading at similarly large discounts to the index levels, and have business models that are well placed to withstand the deteriorating economic climate; generally demonstrating solid structural growth and defending margins better than most.
Energy transition, opportunities and challenges in the context of emerging and frontier markets
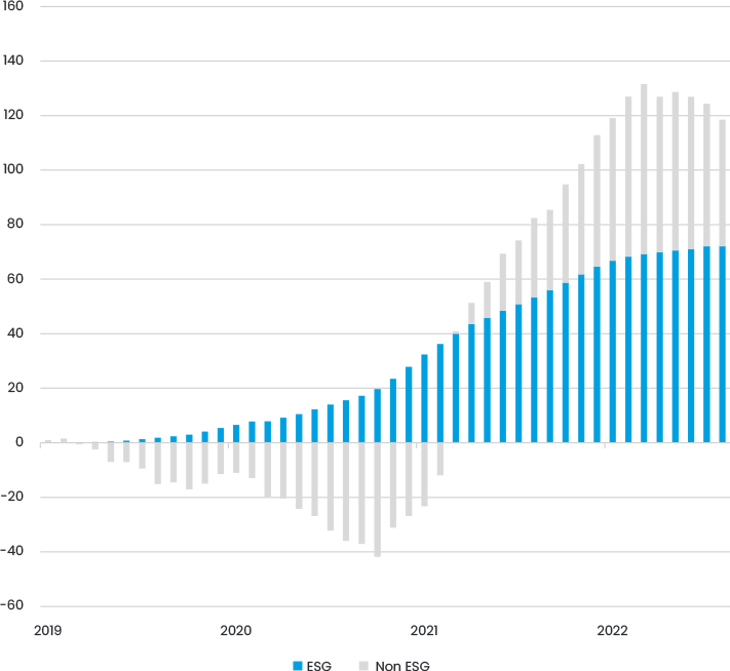
2022 was yet another interesting year for sustainability. While global flows were highly volatile, ESG flows continued unabated, with 60% of all global equity flows since 2019 going into “ESG funds”, as shown in Figure 13. As such we believe that ESG investing does become a slightly self-fulfilling prophecy in terms of performance, and that finding undiscovered companies with strong sustainability profiles and some degree of positive impact across their value chains can be a strong source of alpha generation. We have made plenty of these types of investments in 2022.
Figure 13. Cumulative flows in ESG vs non-ESG funds, USDbn
From the policy side, while the US Inflation Reduction Act (IRA) grabbed all the headlines, we see investments in renewables growing rapidly across our investment universe, for example India added 15.5GW of renewable capacity in 2021-2022 and China added 120GW in 2021. This will continue, with the IEA recently predicting that global capacity will grow by a staggering 2,400 GW by 2022-27, an 85% acceleration from the previous five years. This is 30% above what they forecasted last year, mainly driven by China’s 14th 5-year plan and market reforms, the IRA and REPowerEU act. However, announcements are not just limited to these countries – even Saudi Arabia is targeting an ambitious increase of renewable power by less than 1 GW in 2021 to 58 GW by 2030. This staggering structural growth will have a profound impact on global renewable supply chains, which remains a crucial investment theme for us going forward.
Of course, the sustainability outlook is not all rosy, with a fairly disappointing COP27 and the increasing acceptance that the door to limiting global warming to 1.5C is very close to being shut. This has led to interesting questions around fiduciary duty for institutions trying to manage portfolios / balance sheets in line with, what is now a highly unlikely scenario and highlights the ethical decisions embedded in ESG investing that are not always clearly explained.
We need absolute emissions reductions not net zero targets
While the corporate world has made large strides on climate governance and strategy, our conversations with portfolio companies are increasingly focused on the level of tangible short-term emission reductions we can expect.
The reasons for this are clear - Transition Pathway Initiative's analysis of the 132 largest listed energy companies suggests that while 51% of companies have climate targets aligned with 2°C or lower based on their 2050 targets (broadly a “net zero” goal), this number is only 24/25% looking at 2025 and 2035 targets. This is clearly not acceptable given that the world needs emissions reductions now - 2040 to 2050 is just too late.
Hence, while there is a proliferation of sophisticated metrics to measure concepts like temperature alignment, we believe we are increasingly getting to a point where the questions to ask boards and companies should be simpler – will your absolute emissions (scope 1-2 and 3 if material) go down in 2023, or not? What about 2024? If not, why not? Only 23% of the emerging markets benchmark reported a YoY fall in Scope 1 and 2 emissions in 2021.
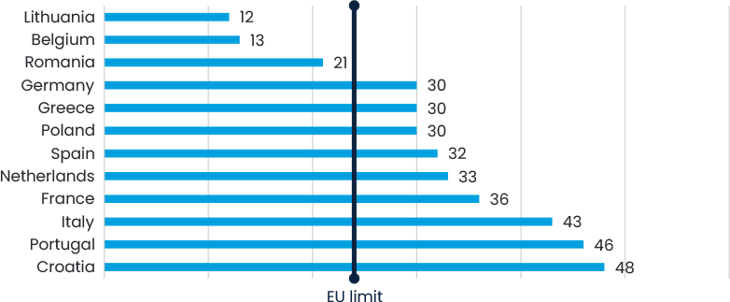
Of course, we and the broader investment community do accept that there is a limit to how far corporates can be pushed to decarbonise without clear government policies that incentivise the more radical transition the world needs. Sadly, while there are some encouraging signs, we do not see enough of these policies in place. One of the most practical issues that we hear when engaging with portfolio companies is the extremely long time it takes to obtain a permit for renewables projects. This is a problem across the globe, Figure 14 shows that average permitting times for renewables projects in the EU, with times exceeding the EU’s stated limit of 24 months by up to 5 times. There are no typos in these graphs, it really is months and not weeks, unfortunately. We hope this will improve going forward, and we expect an increased focus on how to engage governments – likely fixed income is the best lever.
Figure 14. Average onshore wind permitting times (months)
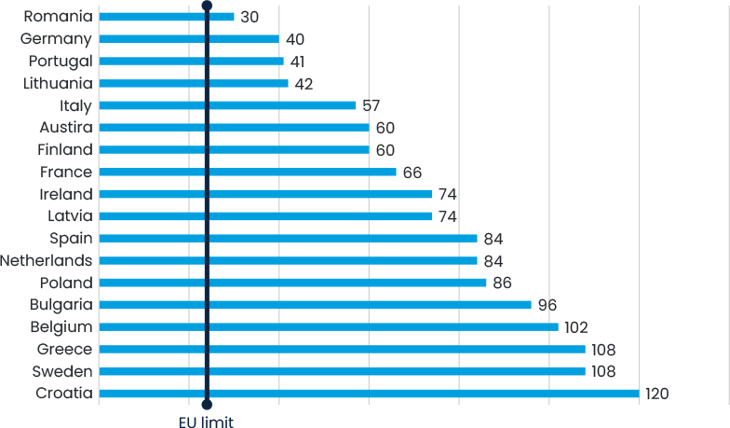
Figure 15. Average solar permitting times (months)
Ensuring a just transition also remains an area that is conceptually important, not least given the high energy prices the world is facing. But as investors it is difficult to find ways to tangibly have an impact on this given we at East Capital are not typically investing and engaging with the actual utility providers, but are instead further up the value chain. However, we welcome the agreement on a loss and damage fund loosely agreed at COP27, which might lead to more funding towards emerging and frontier markets which are the most vulnerable to the effects of climate change.
Data, but for what for?
We expect 2023 to be the catalyst year in terms of ESG data. In many jurisdictions around the world including China, EU, Philippines and Brazil, companies face an increasing burden when it comes to reporting, as required by regulators or as requested by various stakeholders, while managers with funds domiciled in Europe have to implement and deepen disclosure requirements under the Sustainable Finance Disclosure Regulation. “What gets measured gets managed” so we do welcome these developments even if we also realise that the real-world impact of these reporting exercises is extremely limited and we don’t believe lack of data should be an impediment for the actual, and tangible, work of responsible owners.
Transition finance, a new asset class aimed at supporting companies, particularly those in high emitting sectors, to align with the Paris Agreement 2030 and 2050 goals by providing the capital needed to facilitate progressive emission reductions, is one such area in which we look forward to being more involved.
Conclusion
Given that we have just experienced one of the strongest months ever for emerging markets, it feels odd to be writing a somewhat guarded outlook for 2023. However, the bleak global growth backdrop combined with high rates and monetary tightening make it difficult to be optimistic. Of course, a lot of this information is “in the price” and markets can perform well when such pessimism is baked into positioning, especially if we see some positive news.
If the US does achieve a broadly soft landing and China does open as we expect, the moderate rotation towards emerging markets we have started to see could well continue as investors focus on the attractive valuations and somewhat more positive macro backdrop offered in emerging markets, and particularly China, versus the US.
At East Capital, we have spent the last 12 months repositioning our portfolios for this “fat and flat” era. We believe exposure to structural growth, the ability to defend margins and exceed consensus expectations combined with reasonable valuations will be the key drivers for company performance, and we have used the volatility (i.e. the “fat” part of the returns) to build stakes in phenomenal companies at highly attractive valuations. We intend to keep doing so.
1 Kenneth S. Rogoff & Yuanchen Yang, 2020. "Peak China Housing," NBER Working Papers 27697, National Bureau of Economic Research, Inc.


